A Robot Position Visualization Interface
Uviz is a robot positional awareness (localization) visualization interface for monitoring the autonomous robot in teleoperation settings. The primary role is to let the researcher correctly understand how the robot is currently perceiving its position regarding the situational context. Therefore, the main challenge was to visualize multiple estimations at once involving heterogeneous data.
Specifically, Uviz addresses two main conceptual functions in implementation. (1) A versatile interface that can accommodate both real-time abstract monitoring and post-experiment in-depth analysis. (2) A cost-effective visualization that can augment the researcher's perception with limited data considering the network constraint of the remote operation setting.
In response to (1), Uviz adopts interface modularization. Uviz modules (windows) are easily added and removed by the researcher's monitoring needs with its componentized ROS(Robot Operating System) subscription service in the Python backend. For (2), Uviz reflects the effective visualization metaphor. These metaphors aim to augment the situational perception of the researcher with a minimal set of information.
Interface Modularization
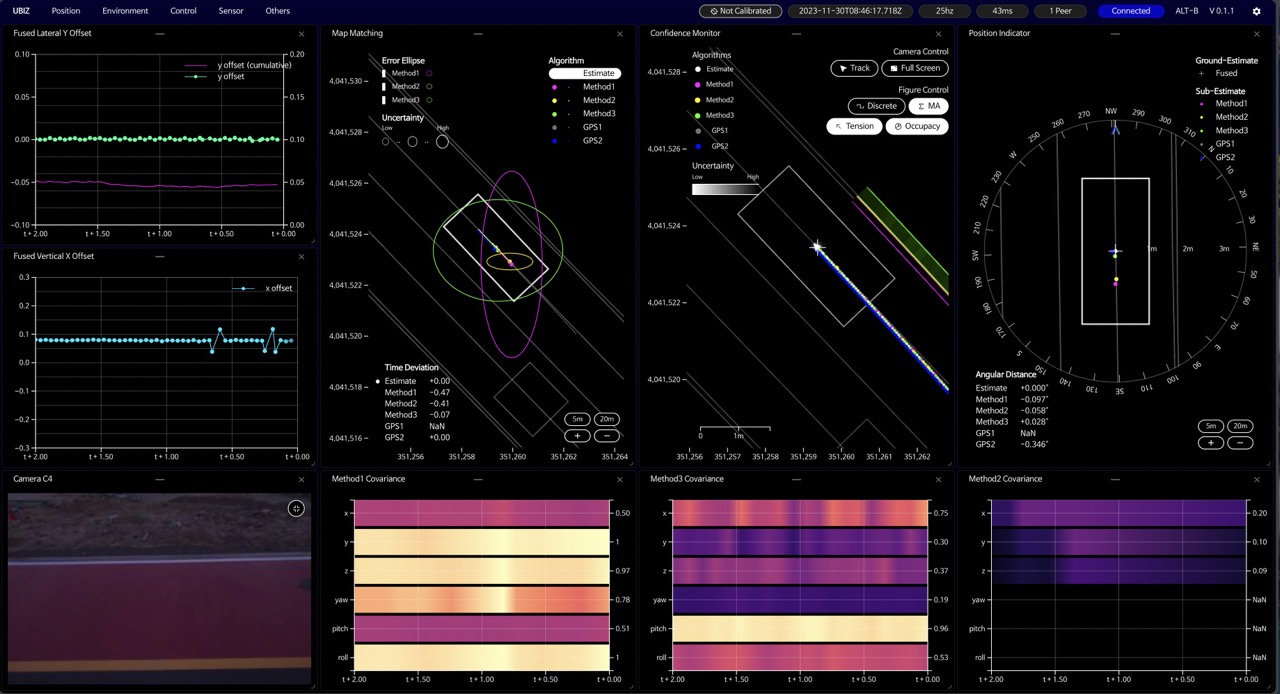
The close-up view of the interface shows how Uviz shows different types of information simultaneously through modularization. The large panel on the left shows the visualization of the robot lidar. The three panels on the right show how the robot understands its current position in terms of optimization, spatial uncertainty, and orientation. Each colored dot in the panels represents the estimates of predictive models. These panels can freely be moved, deleted, and resized.
The idea of interface modularization has been prevalent in autonomous car research. Yet, the distinctive feature of Uviz is that it implements the concept through drag-and-drop API, leveraging the browser's native animation. Based on the API, Uviz supports interactive animations such as drag-and-drop and overlap-to-remove for each module window.
Combining Visualization Techniques
In response to various research needs, Uviz implemented multiple visualization modules. These include line charts, radar, heat maps, geographical maps, and other novel techniques. Each specializes in revealing the multi-variate positional estimate and situational context in numeric values. To implement each idea, Uviz combines Canvas, SVG, and MediaStream (WebRTC) to achieve each visualization method. Additionally, Uviz utilizes the D3.js interpolation to provide a smooth animation experience.
Pointcloud Calibration
Additionally, Uviz supports a lidar-based position calibration. It overlaps two point clouds to let the researcher measure the deviation of the robot's positional estimation from the ground truth. One represents the live lidar-scanned point cloud while the other reveals the indexed point cloud based on the currently estimated robot position.
By comparing two point clouds, the researcher can accurately estimate the size of the estimation error. To assist in accurate decision-making, Uviz illustrates the error size by a color gradient to help the researcher. In interface, the pink indicates an increase in deviation and cyan indicates the increasing proximity between the two.
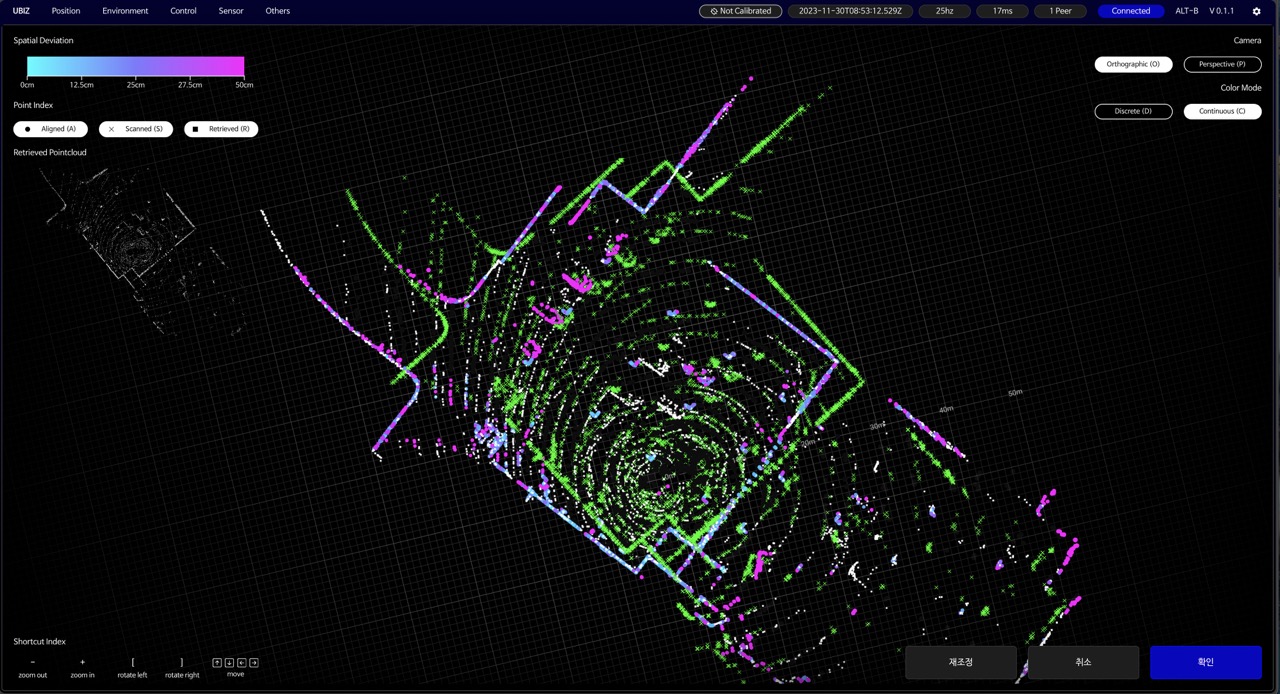
Addtionally, to increase the precision, Uviz implements an orthgraphic camera that synchronizes the 6-dof camera movement with a perspective camera. A researcher can measure the difference accurately without distortion. Also, it implements a custom shader to differentiate each point shape and color between point clouds for easier identification of the deviation.